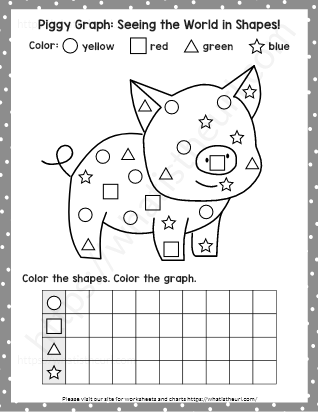
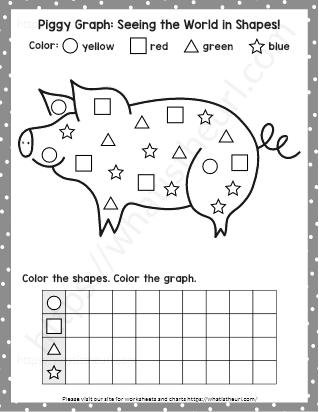
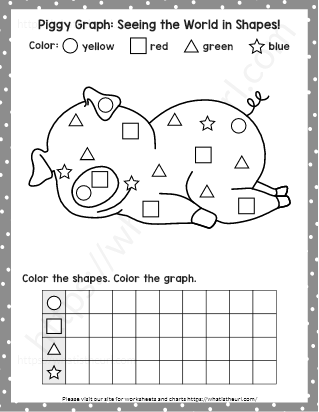
On top, you can see an image of a pig. The students will use colored pens – yellow, red, green, and blue – to color the circle with yellow, the square with red, the triangle with green, and the star with blue. Through this worksheet, students can have fun while learning about colors and shapes.
Please download the PDF Piggy Graph – Seeing the World in Shapes